
What this reference is
This page applies deterministic formulas to fixed examples. It is not a market study, proprietary market research, a prediction, or a recommendation. The tables do not use a live market-data API.
Drawdown recovery table
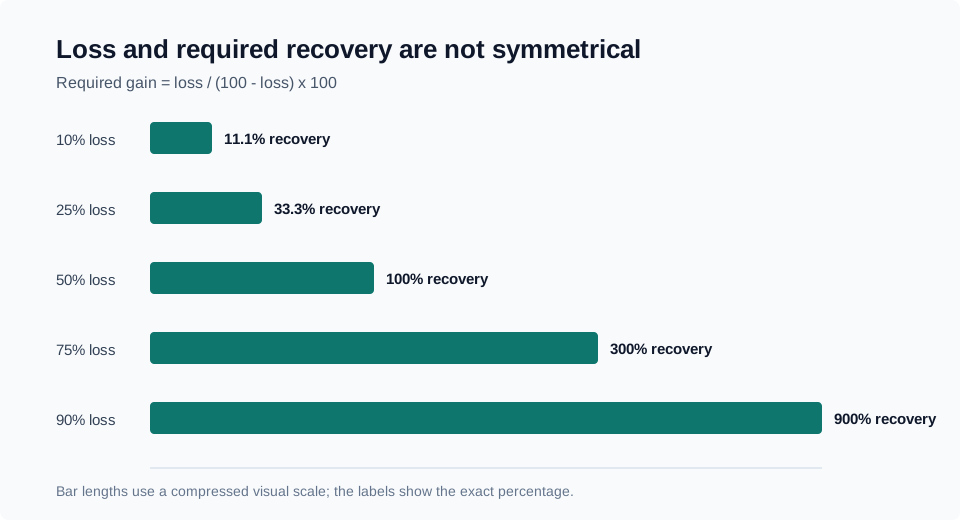
A loss and the gain needed to recover are not symmetrical. After a loss of L percent, required recovery is L / (100 - L) x 100. A 50% loss needs a 100% gain to return to the starting value; a 90% loss needs a 900% gain.
| Loss | Recovery required |
|---|---|
| 5% | 5.26% |
| 10% | 11.11% |
| 15% | 17.65% |
| 20% | 25.00% |
| 25% | 33.33% |
| 30% | 42.86% |
| 35% | 53.85% |
| 40% | 66.67% |
| 45% | 81.82% |
| 50% | 100.00% |
| 55% | 122.22% |
| 60% | 150.00% |
| 65% | 185.71% |
| 70% | 233.33% |
| 75% | 300.00% |
| 80% | 400.00% |
| 85% | 566.67% |
| 90% | 900.00% |
crypto-drawdown-recovery-reference.csv with loss and recovery values.Fee break-even reference
The simple break-even movement is the sum of entered fee and spread assumptions across each side of execution. Real costs can be higher because slippage, funding, withdrawal fees, market impact, and partial fills are not included.
| Scenario | Fee per side | Spread per side | Sides | Break-even |
|---|---|---|---|---|
| Low-cost limit-order assumption | 0.05% | 0.02% | 2 | 0.14% |
| Standard spot assumption | 0.10% | 0.05% | 2 | 0.30% |
| Wider execution-cost assumption | 0.20% | 0.10% | 2 | 0.60% |
crypto-fee-break-even-reference.csv with fee and spread assumptions.Position-size examples
Position units equal the remaining risk budget after estimated fees divided by the absolute distance between entry and stop. Leverage changes margin and liquidation mechanics; it does not shrink the underlying planned-loss calculation.
| Example | Account | Risk | Entry / stop | Units | Notional | Planned loss |
|---|---|---|---|---|---|---|
| Long: Long with a 5 USD stop distance | $10,000 | 1% | $100 / $95 | 18.00 | $1800.00 | $100.00 |
| Short: Short with a 10 USD stop distance | $15,000 | 0.75% | $200 / $210 | 10.00 | $2000.00 | $112.50 |
| Long: Smaller account and fractional-price asset | $5,000 | 0.5% | $2 / $1.8 | 120.00 | $240.00 | $25.00 |
crypto-position-size-examples.csv with example risk, entry, stop, and loss values.Cite this reference
PartnerCrypto Research. “Crypto Risk Math Reference: Position Size, Drawdowns & Fee Break-Even.” PartnerCrypto, reviewed July 16, 2026. https://www.partnercrypto.com/learn/crypto-risk-math-reference
Methodology and limitations
Values are produced by tested shared utility functions and rounded only for display or CSV readability. The fee scenarios are assumptions, not claims about a platform. The position examples assume the stop fills at the entered price and therefore do not model gaps, slippage, liquidation, funding, or order-book depth.
Sources
- PartnerCrypto tested risk-math and calculator utilities.
- Investor.gov crypto-assets education
- FINRA fees and commissions education